
Page 44 - Annual Report 2011
P. 44
Financial Ratio Analysis
Liquidity Ratio Efficiency Ratio
In 2011 the working capital ratio of CMMU was In 2011, a Return on Assets (ROA) a ratio of net
3.49 times compared to 2.91 times in 2010. profit to total assets shows effective asset
Current assets were 95.7% of the total assets. management towards profit generation. In
Thus the College had more opportunity for the current year ROA increased from the
investment in infrastructure. CMMU proposed a previous year, from 2.90% of total assets in
budget for building improvement and 2010 to 8.89% of total assets in 2011. This
decoration of 200 million baht in 2011 and 2012. indicates that effective asset management
Furthermore, CMMU sought a profit from generated higher profits than in 2010.
investments and assigned the Risk
Management Center of Mahidol University to Operation Profit Margin
manage the investment capital this generated
increased income.
In 2011 CMMU had an operational profit
margin of 19.02% of total revenues minus
Leverage Ratio interest, an increase from 2010. This is
attributable to control of capital and
In 2011 the leverage ratio of CMMU was 0.27 operational costs. As a result, there was an
times. The capital ratio from loans was very low increase in accumulated surplus income
because accumulated income derived from allowing greater flexibility in plans for
operations instead of loans. investment and infrastructure development.
25
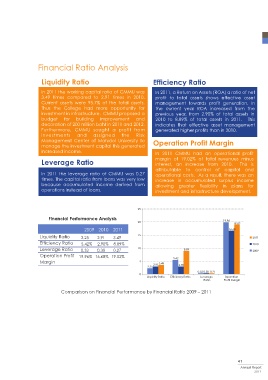
Financial Performance Analysis
20 19.96
19.02
2009 2010 2011 16.68
Liquidity Ratio 2.25 2.91 3.49 15 2011
Efficiency Ratio 5.42% 2.90% 8.89% 2010
Leverage Ratio 0.32 0.30 0.27 10 8.89 2009
Operation Profit 19.96% 16.68% 19.02% 5.42
Margin 5 3.49
2.91 2.90
2.25
0.32 0.30 0.27
0
Liquidity Ratio Efficiency Ratio Leverage Operation
Ratio Profit Margin
Comparison on Financial Performance by Financial Ratio 2009 – 2011
��
Annual Report
����